Game of Thrones
Network and Text Analysis
Project's main idea
Game of Thrones is a series of fantasy book novels which became a TV series in 2011. In this show, there are many houses which claim the reign of the Kingdom of Westeros and the Iron Throne. There are others who want to win their indipendancy. Between these houses there are aliases as well as conflicts. The final season was going to answer some basic questions regarding the main characters, the most important questions are as followings; Who is going to be the heir of the Iron Throne? and Did the ending satisfy the fans?
Our main idea is to give insights regarding the character connections for those who haven't seen the series yet. Therefore, first we show the way the main characters connect with each other, and the houses they represent. As it is well known, conflits are occuring between houses. Therefore, connecting houses with the character is important for our case. We will investigate what kind of changes have been made over the seasons, and finally analyze tweets regarding the final season.
Why are we interested
We were fans of the show and really excited about the release of the final season. Some of us were not really satified about the ending and thus, we wanted to investigate whether other fans had the same opinion with us. Also, the network analysis will give users who haven't watched the show a slight idea about the story & the characters and might get their interest.
Datasets
We used three datasets for our project. The first one, is the Game of Thrones Wiki, which we used to get the information about the charactes and then create the network. The second one is the Movie Transcript Databasewhich we used to get the script for every episode, in order to use it later for sentiment analysis. After downloading the wiki pages, we end up having 80 files for the characters, and 73 txt files with the script of every episode. The last dataset is the Game of Thrones S8 Twitter, which we acquired from Kaggle, and contains tweets relevant to the final season. This dataset contains a csv file of size 698MB. Initially, it had 760,661 observations and 88 attributes, most of them being useless so after preprocessing our dataset the final size is 35MB with 121,458 observations and 17 attributes.
Plan
First of all, with the Wiki dataset we have created the network showing how characters connect with one another. In order to do so, we downloaded the wikipages through an API so in the end, we have 80 files, as many as our characters. Then we obtained the scripts of each episode. At the end of our analysis, we applied sentiment analysis for each episode. Lastly, we analyzed text from the tweets. This is achieved by removing hashtags, tags and emojis and keeping the main text of the tweets. The main goal is to perform sentiment analysis again, so we can understand how Twitter users feel about the ending of the show.
Network Analysis
The first thing we are interested is to create a network to show how characters connect with each other. In order to so, we downloaded the wiki page containing information for every character, which is going to be a node in our network. In the character's page there are links to other characters pages, this indicating that these characters connect which means that we have an edge between them. The number of appearances in the characters page is going to be the weight of every edge. Doing this procedure for every character, we acquire the following network.
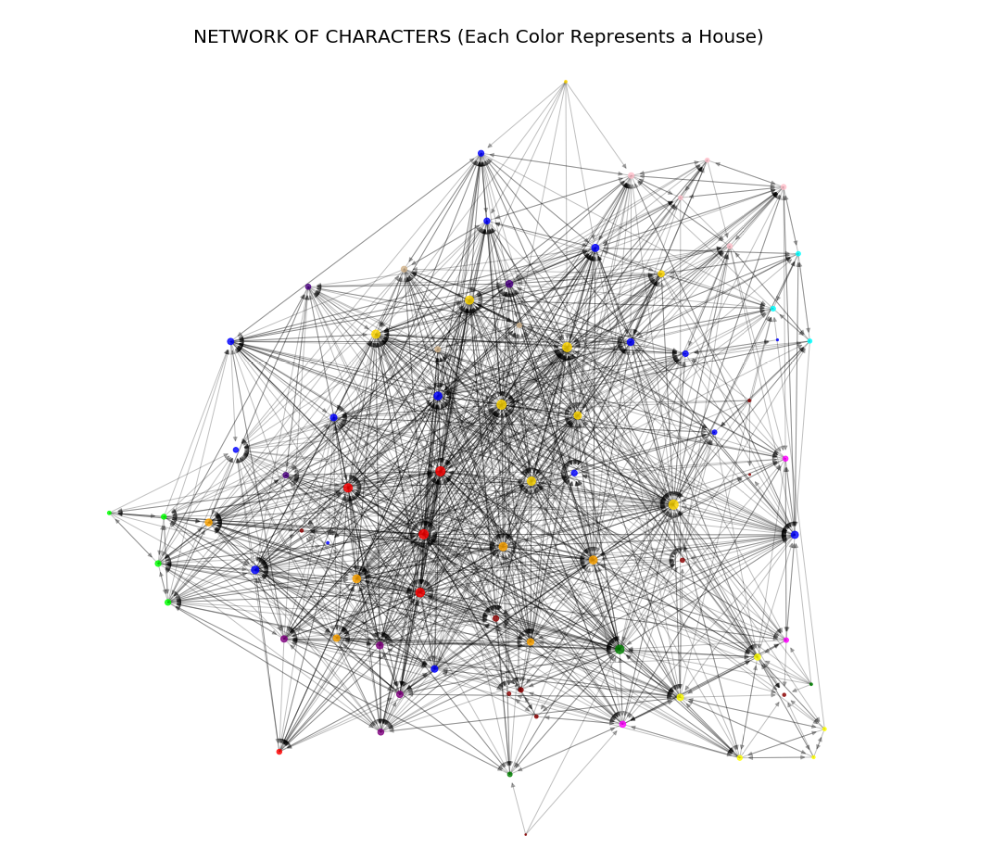
When we draw the graph, we want to distinguish the house of every charcter belongs to and thus we color every node according to the different houses. (Our threshold is 3. If there are 3 or more members of a house we specify each house with a color. If number of house members are less than 3 they are colored as 'blue'.) There are some characters which doesn't belong to a known house. Therefore they are classified as 'Unknown' and their color is 'darkred'. We create a list with colors according to the character and we set every nodes size proportional to its degree. The following plot shows the degree distribution of the network.
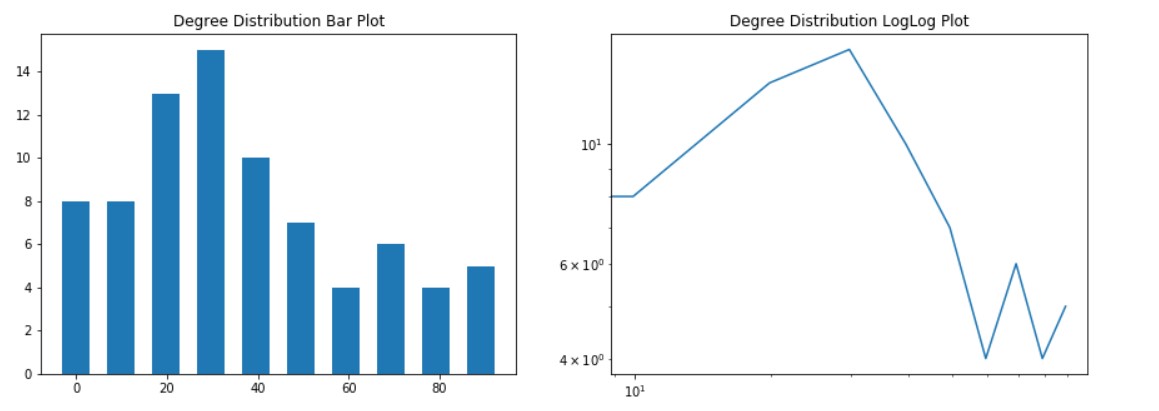
The average degree of the network is 41.85, meaning that each node on average has a high number of links. It can be seen that the degree distriution resembles a poisson distribution, meaning that the network is similar to a random network.
As a next step, we want to examine how eigenvector centrality and betweenness centrality are going to affect our graph. Eigenvector centrality is a network measure where nodes tend to connect with nodes with the similar eigenvector score. This measure can show us how a node can influence the graph. On the other hand betweenness centrality is a meausre based on the shortest path between nodes. The results after applying these two measures in our graph can be seen below.
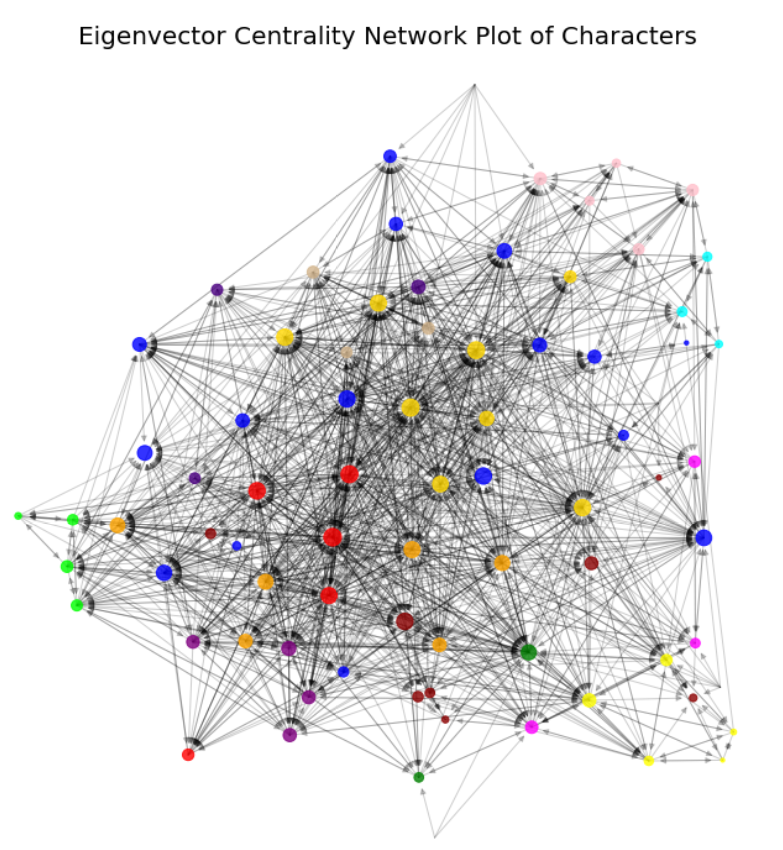
For the Eigenvector Centrality above, there are more than one nodes which has higher values of eigenvector centrality. Because during the series, there were so many powerful characters which have influenced the stories a lot. Therefore the bigger nodes are the ones affecting most.
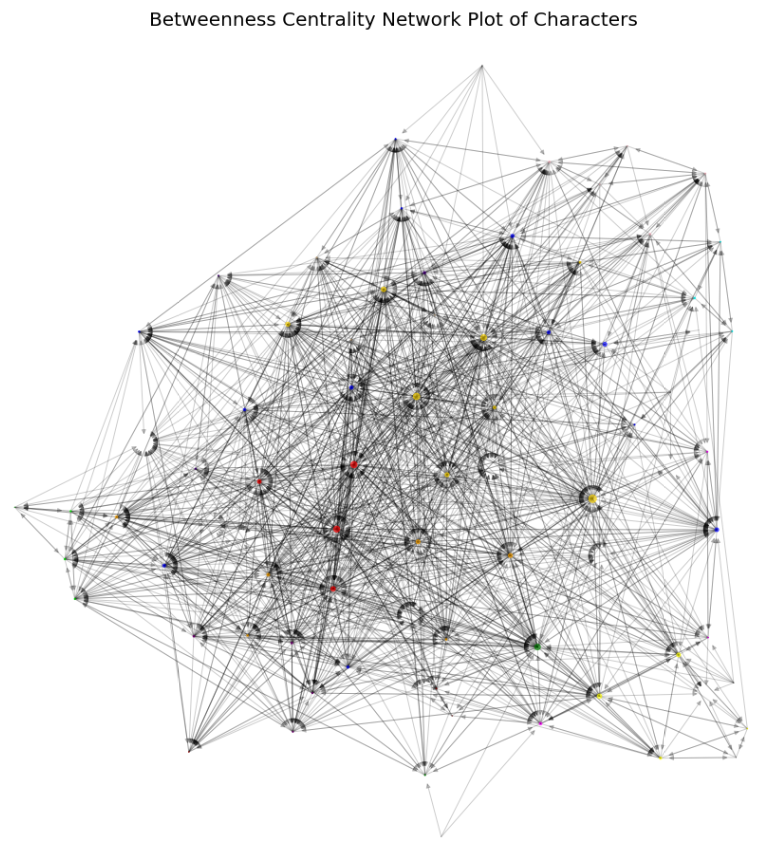
For the Betweenness Centrality graph above, some characters has high values of betweennes centrality since they are really related in the show as a part of the script. There are direct communication between these characters, therefore shortest path is created in this relation. Especially main characters should have higher values since they are connected to directly or at least they act as a bridge along the shorthest path between nodes.
Nodes still remain colored according to the house they belong to, but their size changes. Looking at the different houses as communities the marginality measure can be used, to examine whether these communities provide a good parition of the network. The maginality measure for this community is 0.3678, meaning that this is a decent partition of the network, however far away from the perfect partition.
So far we made the coloring of each node according to the house they represent. But is this the best partition that can be done? The final step is to examine if there is a better partition in our network. Using the Python Louvrain algorithm for community detection, a partition with marginality 0.4478 is found. This partition is therefore better than using the houses as community. The partition created can be seen in the following drawing.
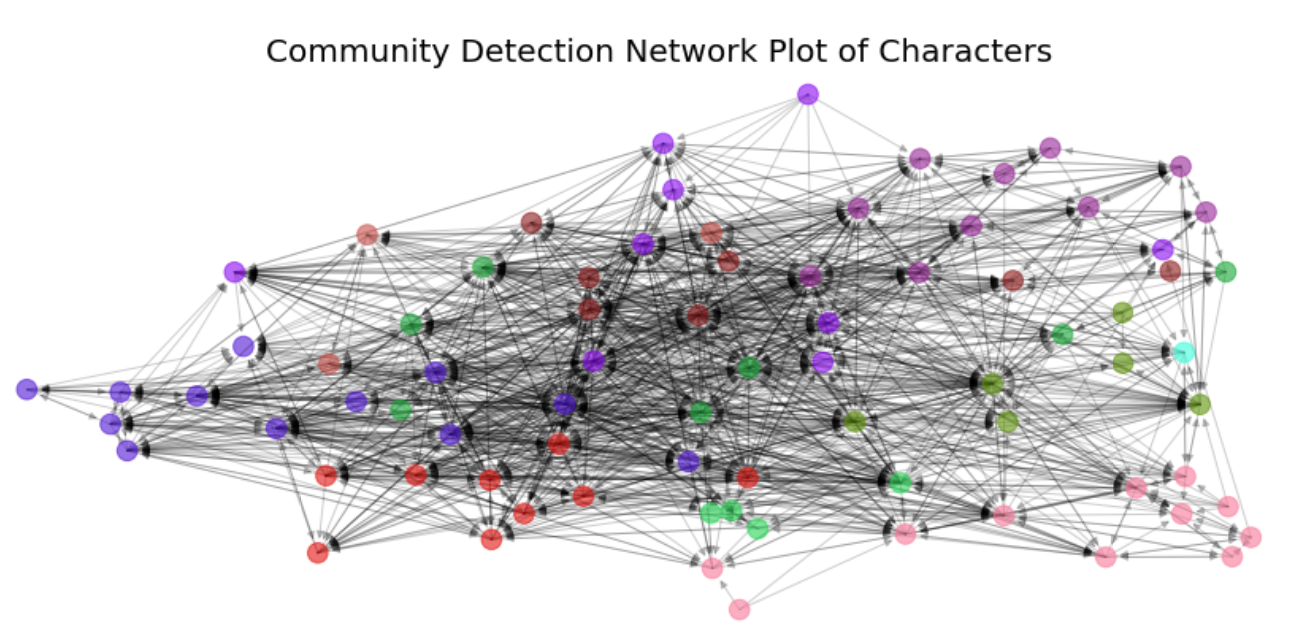
As we can see from the figure, there are less partition than the number of houses we have defined. Specifically, we notice about 5 to 6 different partitions but actually we have 15 houses. Looking a bit into the partition some interesting observations can be made. I.e. Ned Stark and Robert Baratheon are in the same partition, which makes sense since the two work closesly together in the first season, where Ned serves as hand to king Robert. Similarly Arya Stark and The Hound are in the same community, again in line with the show, since they travel together through Westeros.
In order to better understand the graph, it's better to create the confusion matrix for it. In the confusion matrix we compare the actual partitions of the nodes, which are the houses they are part and the partitions created by the algorithm. The result is shown in the matrix below.
| Actual | partition | |||||||||||||
| S | B | L | Tgr | Tr | K | Trll | M | Ubr | G | Mrm | A | U | ||
| S | 2 | 3 | 0 | 0 | 0 | 1 | 1 | 2 | 0 | 0 | 0 | 0 | 0 | |
| B | 1 | 0 | 2 | 0 | 0 | 1 | 0 | 0 | 0 | 0 | 2 | 1 | 0 | |
| L | 0 | 1 | 2 | 0 | 0 | 0 | 0 | 0 | 0 | 0 | 2 | 0 | 0 | |
| Tgr | 0 | 0 | 0 | 1 | 2 | 0 | 0 | 0 | 0 | 0 | 0 | 0 | 0 | |
| Tr | 0 | 0 | 0 | 0 | 5 | 0 | 0 | 0 | 0 | 0 | 0 | 0 | 0 | |
| K | 0 | 0 | 0 | 0 | 0 | 0 | 0 | 0 | 5 | 0 | 0 | 0 | 0 | |
| Predicted | Trll | 0 | 0 | 4 | 0 | 0 | 0 | 0 | 0 | 0 | 0 | 0 | 0 | 0 |
| partition | M | 0 | 0 | 0 | 0 | 0 | 0 | 0 | 0 | 0 | 0 | 4 | 0 | 0 |
| Ubr | 1 | 1 | 0 | 0 | 0 | 0 | 0 | 0 | 1 | 0 | 0 | 0 | 0 | |
| G | 0 | 0 | 0 | 0 | 0 | 0 | 0 | 0 | 0 | 3 | 0 | 0 | 0 | |
| Mrm | 0 | 0 | 0 | 0 | 2 | 0 | 0 | 0 | 0 | 0 | 0 | 0 | 1 | |
| A | 0 | 0 | 0 | 0 | 0 | 0 | 0 | 3 | 0 | 0 | 0 | 0 | 0 | |
| U | 0 | 0 | 0 | 3 | 2 | 3 | 0 | 0 | 0 | 0 | 2 | 0 | 0 |
where
| S | Stark |
| B | Baratheon |
| L | Lannister |
| Tgr | Targaryen |
| Tr | Tarly |
| K | Karstark |
| Trll | Tyrell |
| M | Martel |
| Ubr | Umber |
| G | Greyjoy |
| Mrm | Mormont |
| A | Arryn |
| U | Unknown |
Only the houses of Tarly, Karstark, Tyrell, Martell, Greyjoy and Arryn have all members just assigned to one specific partition. We don't expect Stark, Baratheon, Targaryen, Lannister houses to be assigned just to one specific partition because member of these houses are very important characters for the series. For that reason, members of these houses are being involved in different partitions upon the subjects such as wars, complots, suicides, assassinations etc.
Series Development
Over the eight seasons that the show has run, the fans have become increasingly frustrated. The general opinion among the fans is that the quality of the show has been declining, especially over the last two seasons. To investigate any reason for this perception, that the show has gotten worse, the wikipages can be used. Each page contains a section describing the characters actions in each season. This section will then describe which other characters the given character is interacting with throughout the season. By extracting this section and finding the links in each season, eight networks can be created that describe the interactions between the characters in the given season. The plot below shows the node and edge count for each season graph.
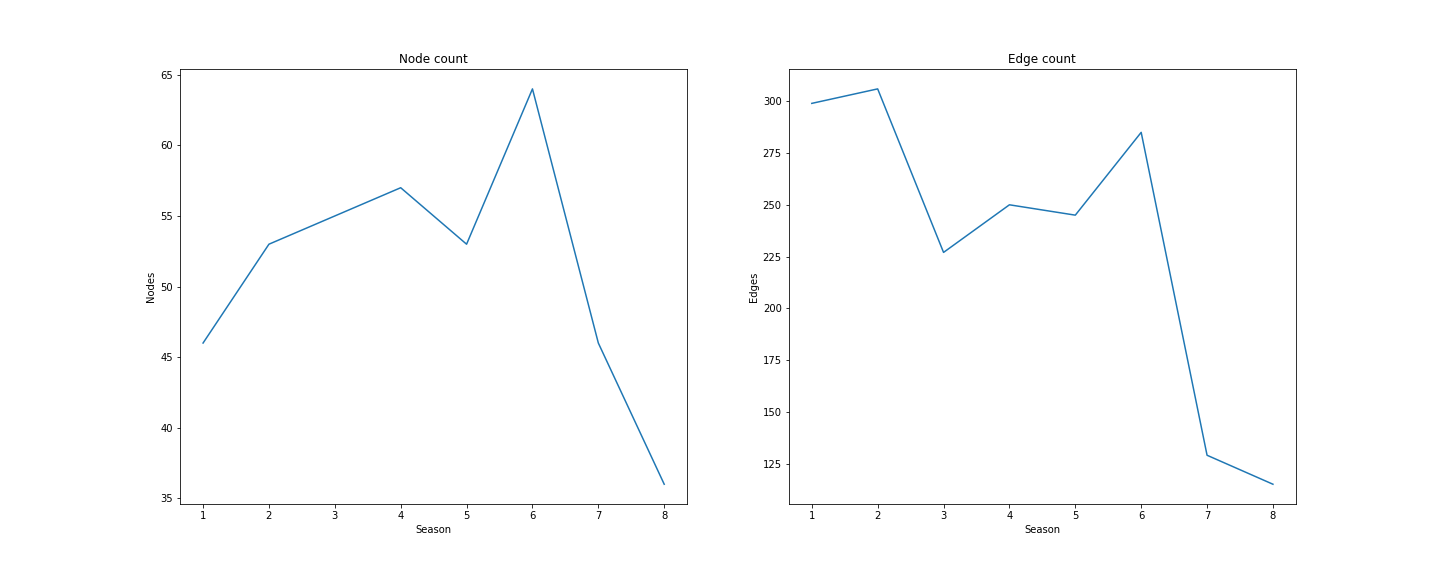
Looking at the number of nodes for each season (graph on the left), it is clear that in the first six seasonsm the number of characters is rising, since new characters is introduced. In the 7th and 8th season the number of nodes drastically decrease. For the edge count a similar pattern can be seen. The number of edges for each season is steadily declining throughout all seasons, however again there is a local maximum at season six and then a steep decline for the final two seasons.
A final thing to investigate on the individual season graphs is the average degree. The following plot shows the average degree for each of the graph.
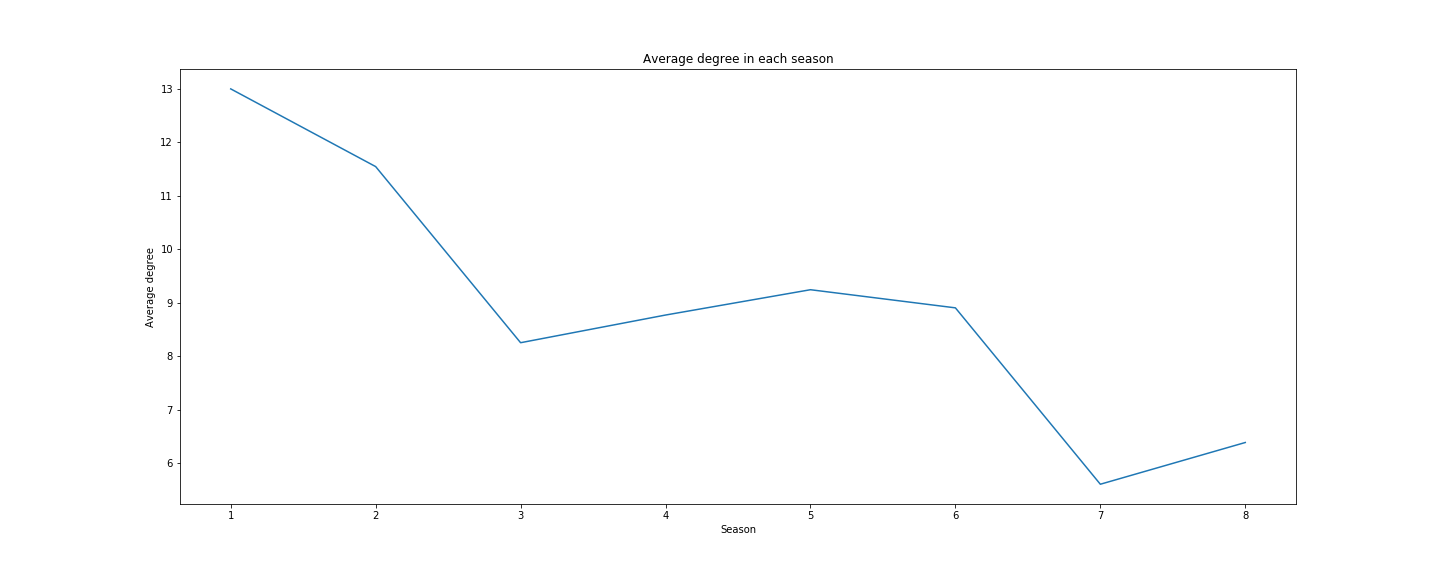
Again it can be seen that there is a declining trend, meaning that the average number of interactions for each character is decreasing.
Overall the trend is that the number of important characters is decreasing throughout the show. This makes sense since the show is known for killing off some of the most loved characters. This can, however, also be one of the reasons why the fans feels it is getting worse. One of the strengths of the show has always been the diverse gallery of characters, and since the number of characters is declining, and therefore the amount of interaction between the characters will also decline, the show can't provide the same type of drama. This also supports the claim that the show has become more focused on creating great action scenes, rather than developing the characters, in the final seasons.
Text Analysis
In our text analysis we are going to examine the sentiment distribution of the episodes and we wil focus on the analysis of the final season based on tweets. First, we are going to calculate the sentiment for each episode based on the script of the episode. The variance of sentiment can be shown in the plot followed.
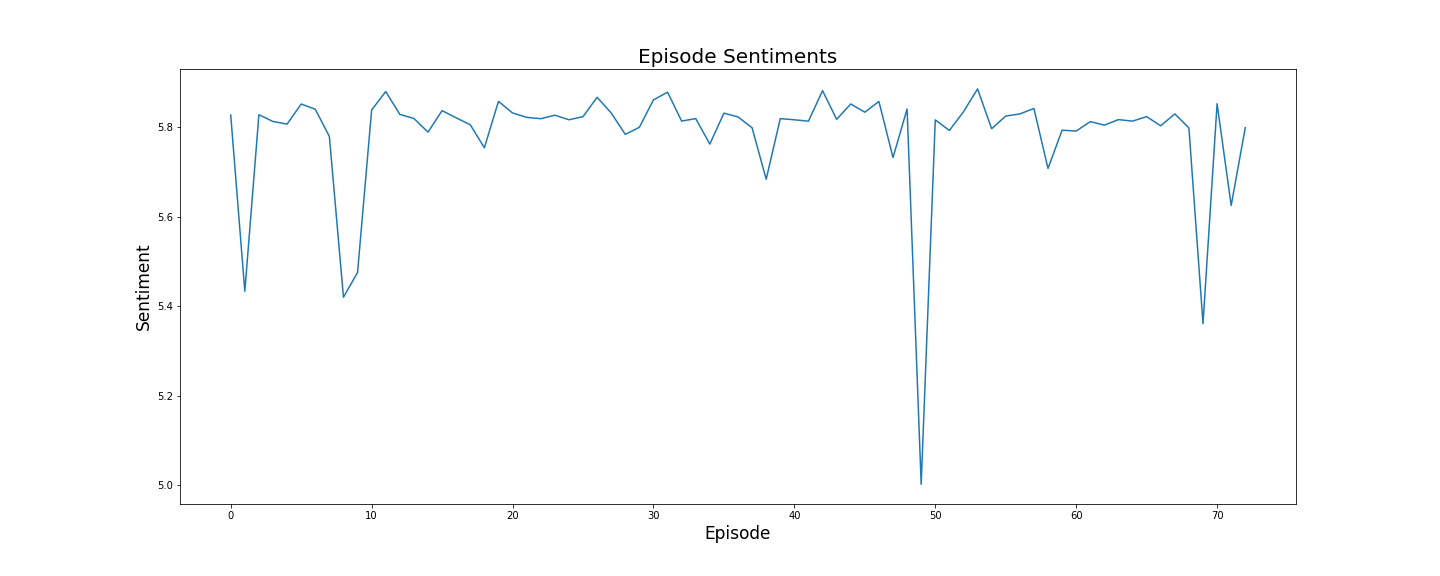
From the plot of sentiments for each episode it can be seen that there is no overall trend of either increasing or declining sentiment for the scripts. Most of the sentiment scores are lying around 5.8, and then there are a few outliers with lower sentiment, which probably can be explained by an episode with a sudden death of one or more characters.
Another thing that could point to a change in the show, is the amount of dialog. To investigate this, the number of meaningfull words, meaning words that aren't stopwords, have been summed for each episode. The result is shown in Figure 8.
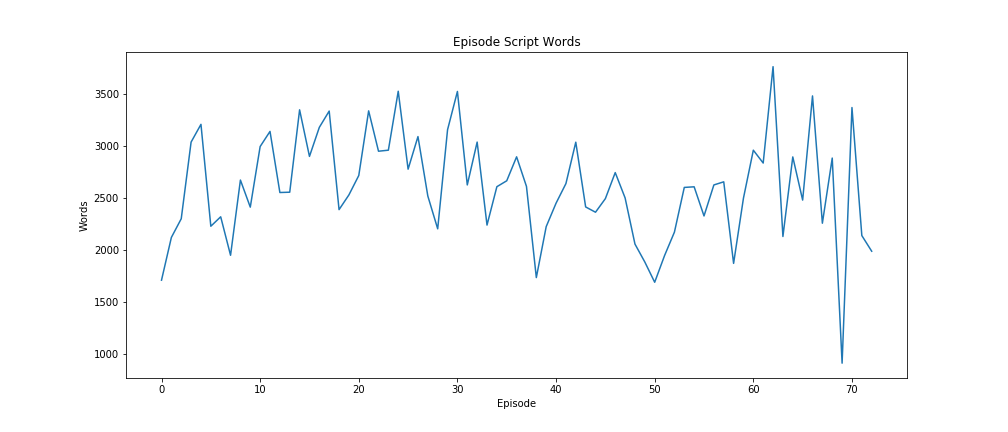
Again there is not a clear trend of the amount of dialog going down or up, but there is still some interesting points to make. Looking at the first 30 episodes there is a slight tendency for the word count to increase. Then the trend turns towards less dialog, and then in the final two seasons the amount of dialog in the episode tend to vary a lot. This could point towards the point that the final seasons had more focus on the action packed scenes, and therefore the wordcount varies from the very dialog-heavy episodes, then followed by a battle episode which is very low in dialog.
The last part of our analysis includes the sentiment analysis of the final season based on tweets. The first step is computing tf-idf in our dataset and the result is to get the most frequent words of it. So we obtained the wordcloud which shows these terms, proportional to their font size.
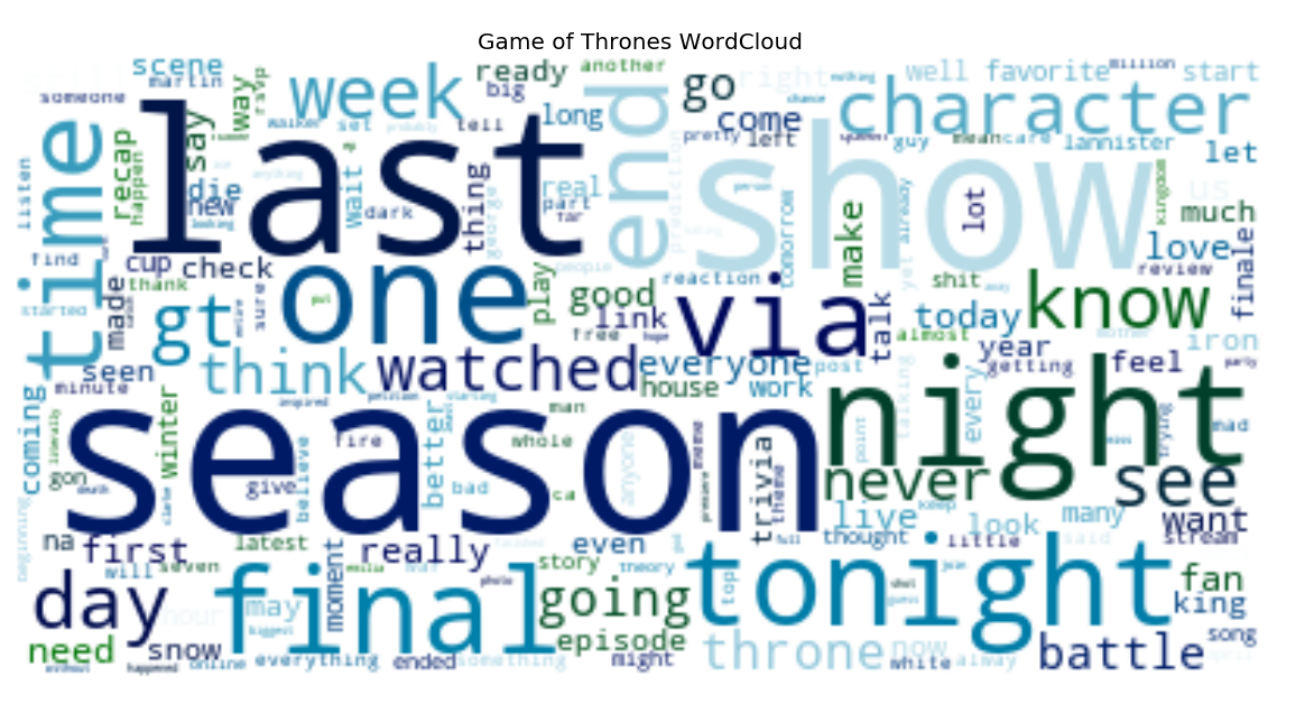
As can be noticed, there are terms like last, season, night, show, snow, throne and battle are some of the examples. These terms are explicitly related to the final season. Afterwards, we have performed sentiment analysis.
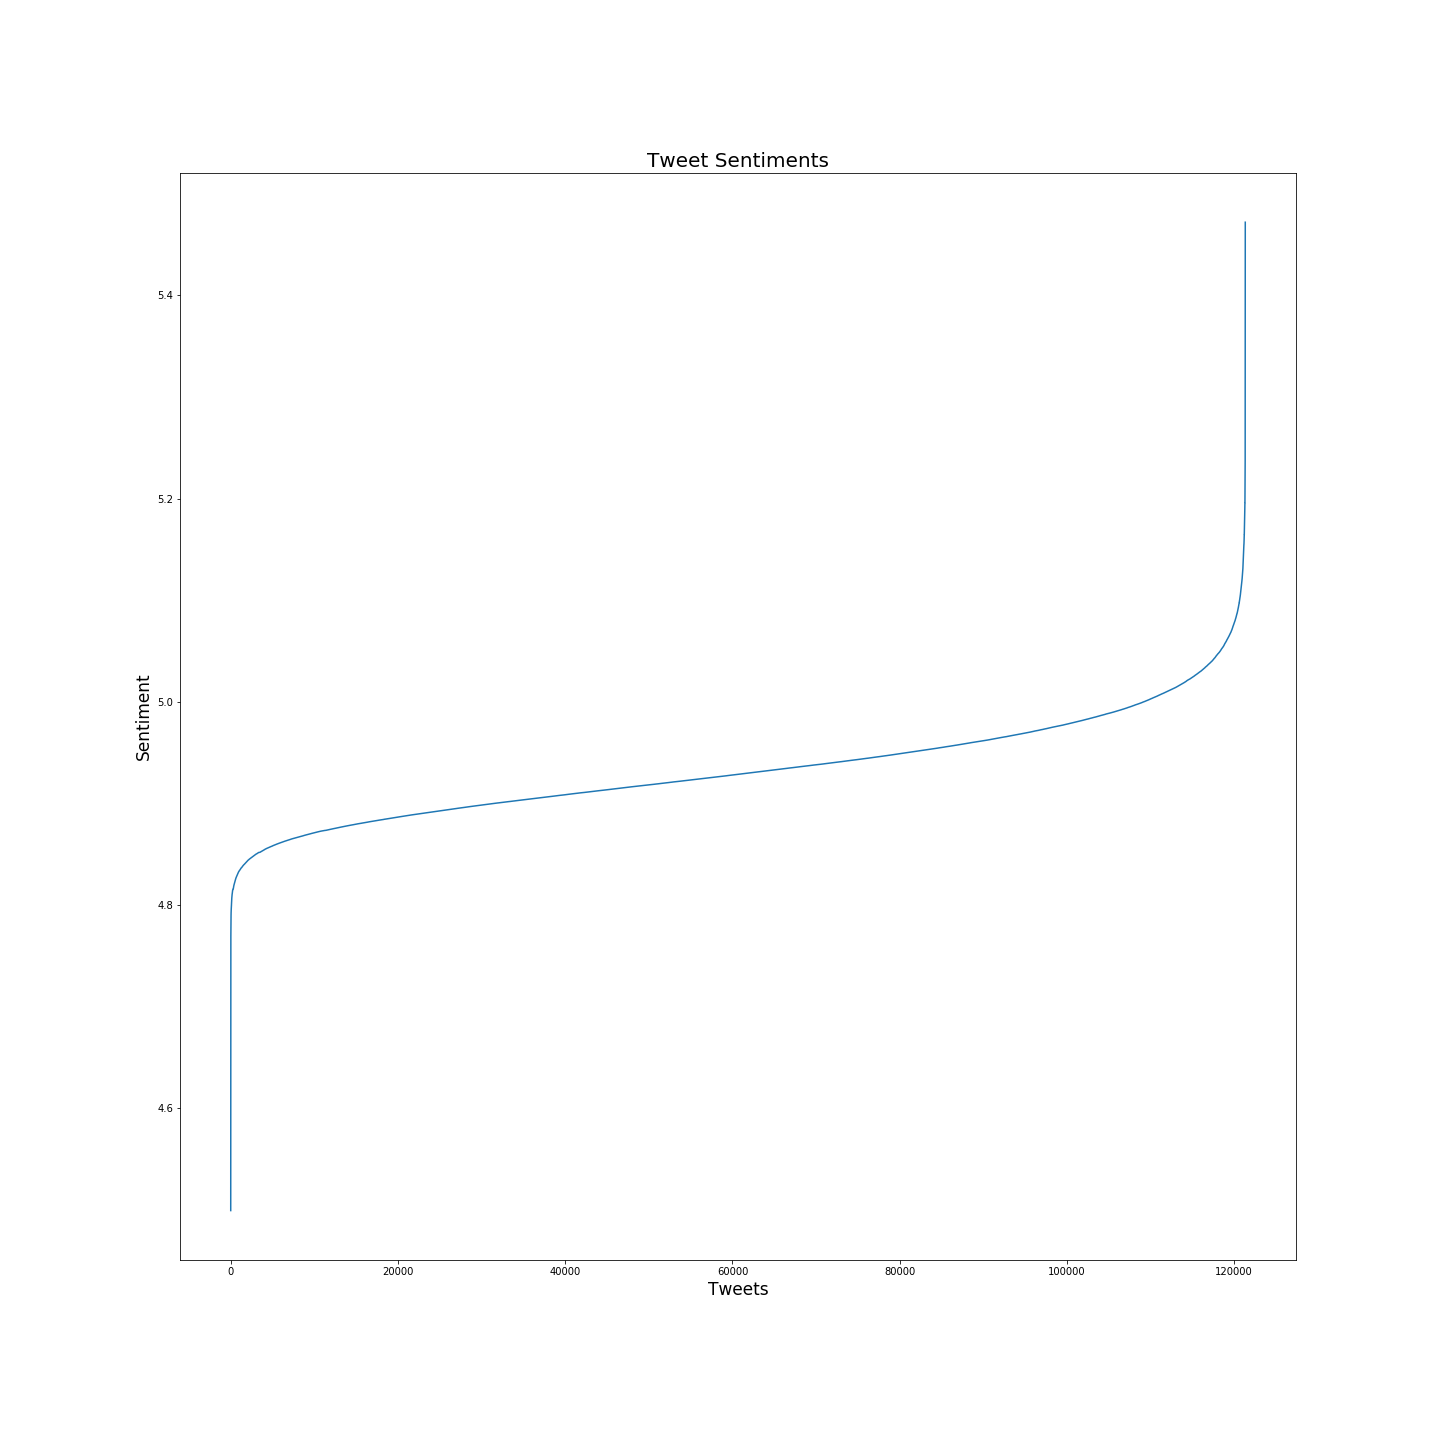
From the plot above, we can conclude that by putting a threshold in the sentiment value, we can distinct the tweets in two groups: positive and negatives. The wordclouds are shown below.
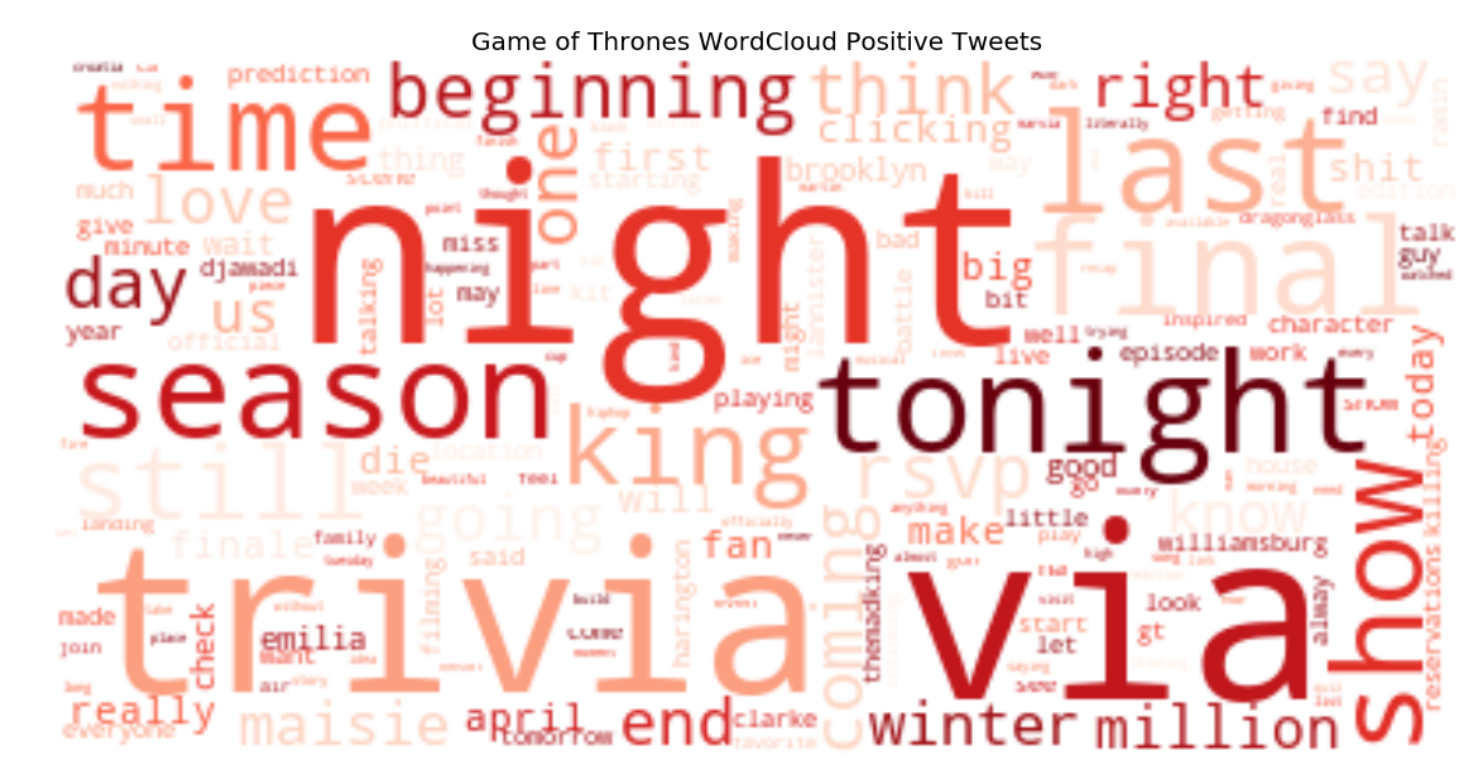
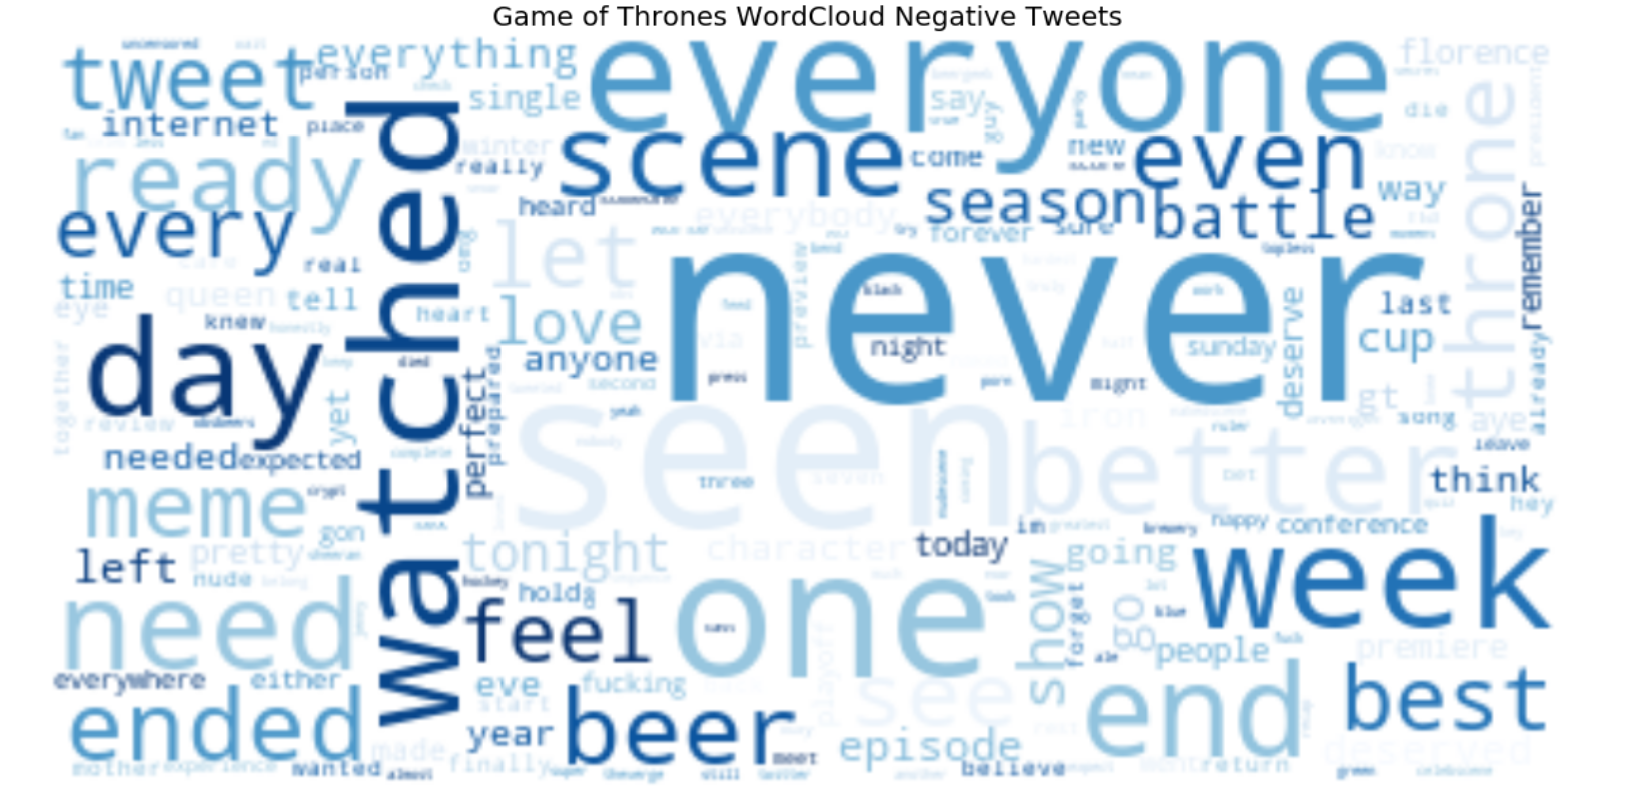
From the wordclouds the tweets are not explicitly distinguished but some of the words are interpretable regarding their meaning in the series and generally. For example, in the negative wordcloud never can imply a negative sentiment. There is also the word love, which has a positive sentiment. However, inside the tweet with hashtags and other words it can be affected for example, love between some characters may not be approved by some fans and it may result love in the negative wordcloud. Regarding positive wordcloud, the night and tonight terms might refer the excitement of the audience for the release of a new episode.
The final analysis is relevant to finding the average sentiment for each character and showing the comparison. The result is shown in the plot below.
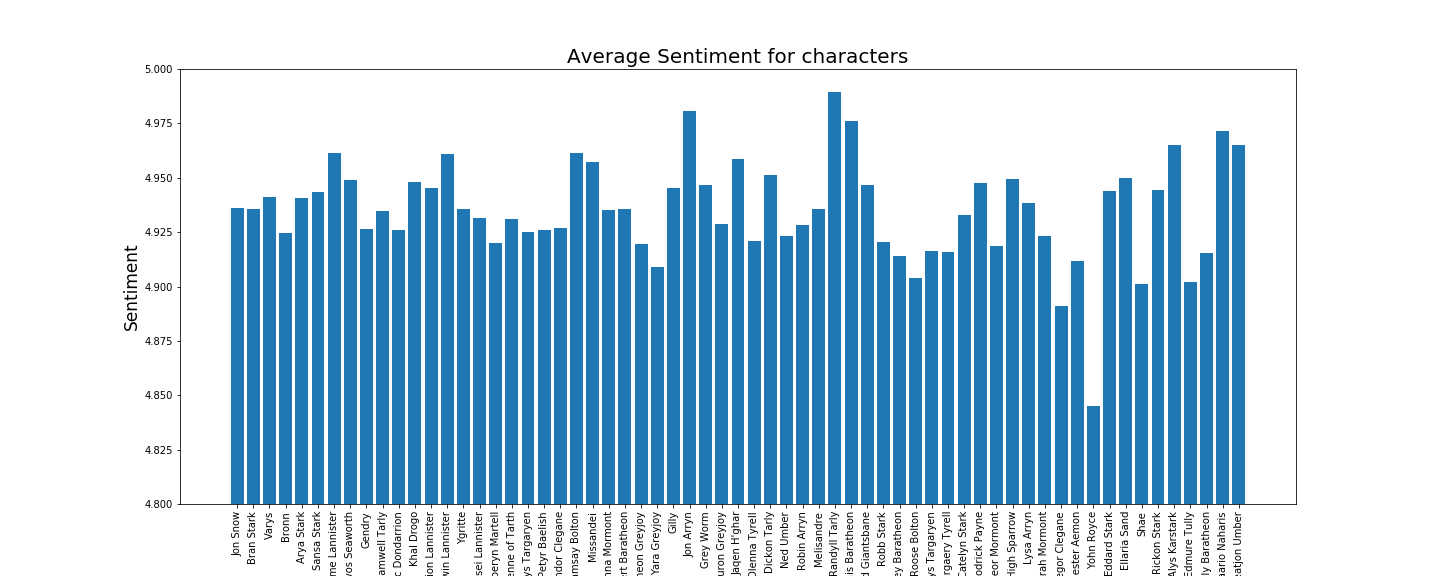
From this plot we can see that suprisingly that Randyll Tarly is the most liked character despite the fact that he appeared in a few episodes but maybe the characters were impressed by the actor's performance. The least liked is Yohn Royce, since he appeared in a few episodes as well and fans didn't give any attention to him.
To investigate whether there is a connection between the fans opinion on the characters and there links in the network community detection is used. The characters in the network are divided into three communities. One for the characters that is liked, one for the disliked characters, and the final for those not mentioned on twitter. This partition has a marginality measure of 0.2, meaning that it is not a very good partition of the network.
More Information
If you want more details about our project or want to take a deeper look in the technical part, you can read our explainer notebook.